
Simulation results can return specific values like -10000, -9999, -9998, -999, etc. These values can be read through picking on the coverage display (CTRL + left click mouse) or from a Point Mapping CSV export.
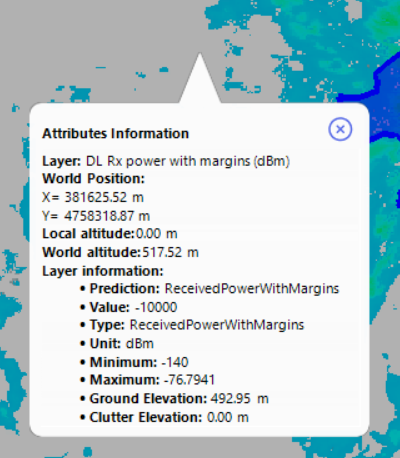
These specific codes are explained in the table below.
|
Code |
Explanation |
|---|---|
|
-10000 |
Possible cases: 1, Out of cell prediction radius; 2, Value under min. Rx power set in Attachment tab of cell properties. |
|
-9999 |
Simulation not required pixels, possible cases: 1, Clutter exclusion; 2, Out of study zone |
|
-9998 |
Value under minimum threshold set in Volcano model (default value -200dBm) |
|
-999 |
Possible cases: Outside of map data zone but within Volcano prediction BBox |