
The Planner tool allows the user to set the standard deviation of the error (dB) based on measuremets and the confidence level to calulate the margins (in dB) to be used for SINR and RSRP. This lets the propagation model to account for statistical uncertainties so that, at a specific confidence level, the user can set the link budget with a desired safety margin.
Standard deviation of the error
RSRP
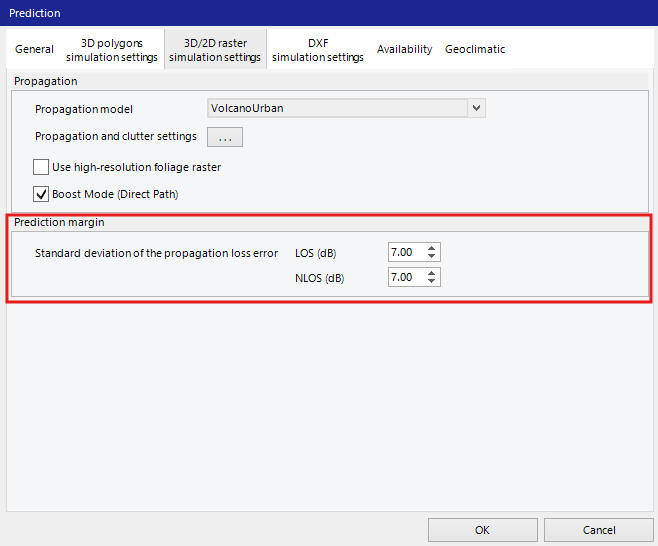
The user can set the 'Standard deviation of the propagation loss error (dB)' used for RSRP margin calculation from the prediction model settings.
SINR
The user can set the 'Standard deviation of the SINR error (dB)' used for SINR margin calculation from the 'Project settings'.
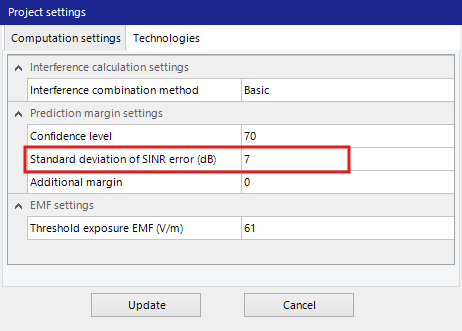
WARNING: The 'Standard deviation of the SINR error (dB)' cannot be less than the 'Standard deviation of the propagation loss error (dB)'.
Confidence level
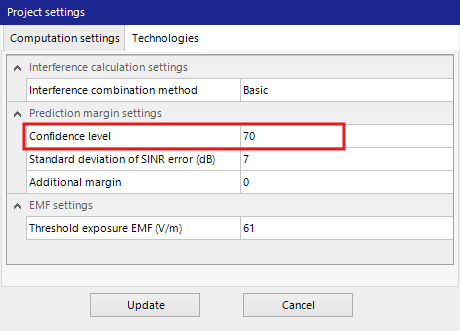
Planner also allows the user to set a 'Confidence level (%)' from the 'Project settings'. It is used to calculate the prediction margin for both the RSRP and SINR.
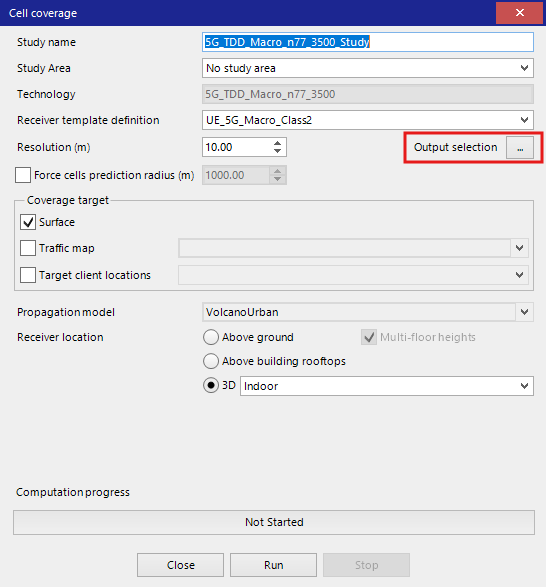
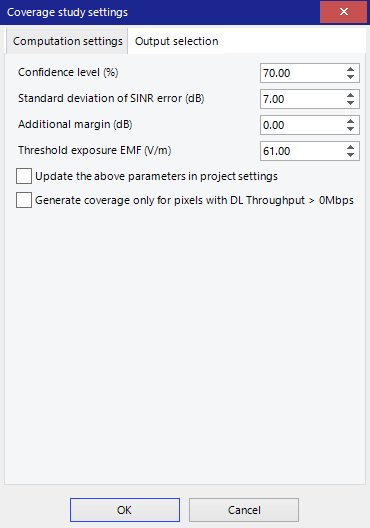
NOTE: The user can override the 'Confidence level (%)' and the 'Standard deviation of the SINR error (dB)' while setting up coverage predictions by going to Output selection → Computation settings.
Margin Calculation and the Normal Distribution
The standard deviation of the error, the confidence level and the properties of the standard normal (Gaussian) distribution are used are used to calulate the prediction margins.
When radio propagation errors are modeled as normally distributed with mean 0 and standard deviation σ, the margin required to meet a certain confidence level is found using the quantile (inverse CDF) of the standard normal distribution.
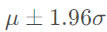
According to the normal distribution properties, a random variable X will lie within the interval 
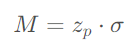
Mathematically, the margin relationship is:
Where:
-
M = required margin in dB

σ = standard deviation of the propagation error (in dB)
Choosing the Z-Score
The z-score represents how many standard deviations away from the mean you need to be to capture your desired confidence percentage in both directions. The z-scores for common confidence levels are:
|
Confidence Level (%) |
Z-Score (
|
Interpretation |
|---|---|---|
|
68 |
1.00 |
±1.00σ captures 68% of actual measured values |
|
90 |
1.645 |
±1.645σ captures 90% of actual measured values |
|
95 |
1.96 |
±1.96σ captures 95% of actual measured values |
|
99 |
2.576 |
±2.576σ captures 99% of actual measured values |
The margin ensures that the actual measured value will fall within ±M dB of the predicted mean value with the specified confidence level.
Example Calculations
Example 1: Using a 95% Confidence Level
Assume standard deviation σ = 7dB and confidence level = 95% 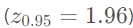

Interpretation in terms of RSRP:
-
Your simulation predicts an RSRP value at a specific location
-
The actual measured RSRP will fall within ±13.7 dB of the predicted mean RSRP value in 95% of cases
-
Only 5% of measurements will fall outside this range (2.5% weaker and 2.5% stronger than predicted)
-
For conservative coverage planning, we use the lower bound (predicted mean RSRP - 13.7 dB) to ensure 97.5% of locations meet the coverage threshold
Example 2: Using a 70% Confidence Level
For a 70% confidence level, the two-tailed z-score is approximately 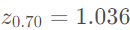

Interpretation in terms of RSRP:
-
The actual RSRP will be within ±7.25 dB of the predicted mean RSRP value in 70% of cases
-
30% of measurements will fall outside this range (15% weaker and 15% stronger)
-
This provides a moderate confidence level suitable for typical planning scenarios
How to Find the Z-Score: The Inverse Normal (Quantile Function)
To get the z-score for a given confidence probability p, use the inverse of the Gaussian cumulative distribution function (CDF):
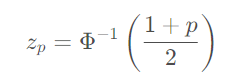
Where 
Summary
-
Larger standard deviation → higher margin needed for the same confidence level
-
Higher confidence level → larger z-score → higher margin required
-
Two-tailed approach → accounts for uncertainty in both directions (signal stronger or weaker than predicted)
-
Margin = z-score × standard deviation gives the dB uncertainty range
By setting an appropriate margin based on the statistical distribution of your propagation errors, you can ensure the reliability of the results obtained from the Planner tool to meet your confidence level requirements. For conservative coverage assessment, we apply the lower bound (e.g. predicted mean RSRP minus margin) to determine if locations meet the service threshold.
Reference Table: Margin vs. Confidence Level
|
Confidence Level (%) |
Two-Tailed Z-Score ( 
|
Margin (σ = 7 dB) |
Uncertainty Range |
|---|---|---|---|
|
68 |
1.00 |
7.0 dB |
±7.0 dB |
|
70 |
1.036 |
7.25 dB |
±7.25 dB |
|
90 |
1.645 |
11.5 dB |
±11.5 dB |
|
95 |
1.96 |
13.7 dB |
±13.7 dB |
|
99 |
2.576 |
18.0 dB |
±18.0 dB |